
In 2004 I completed my Masters Degree from SUNY Albany in Geology.
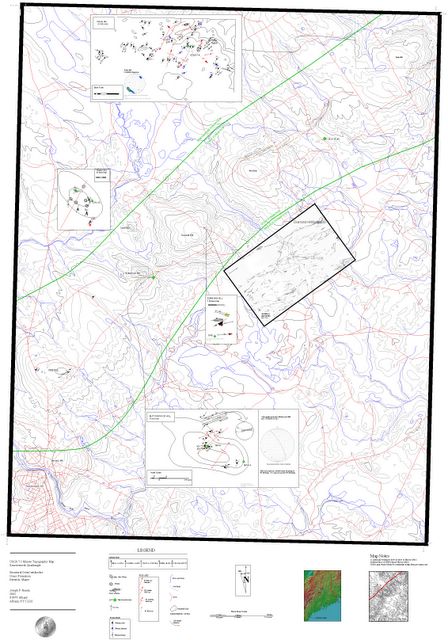
This is the map I made. I made it by converting the topo quad of some type of GIS file to a CAD file. Then I was able to add all kinds of overlay info. I figure I have at LEAST 100 hours into it. The quad is skewed about 3 degress clockwise because it was a bum scan and I didnt fix it when I did the map. Whatever.
To read my abstract click HERE.
 I plan on posting more of the thesis here in the future. I have many cool photos (PPL and Cross Polar Photomicrographs) and diagams that'd make for entertaining viewing. Next Ill post a larger version of the slanted center inset graphic on this map. It shows some real cool deformed quarts veining, strong foliation and a granite dike.
The basic concept I belive I discoverd is that this section of the Norumbega Fault Zone shows evidence of sinistral (left lateral) deformation. As opposed to dextral (right lateral, like the San Andreas) motion.
No comments:
Post a Comment